Stay compliant and avoid lost mileage with new distance reporting
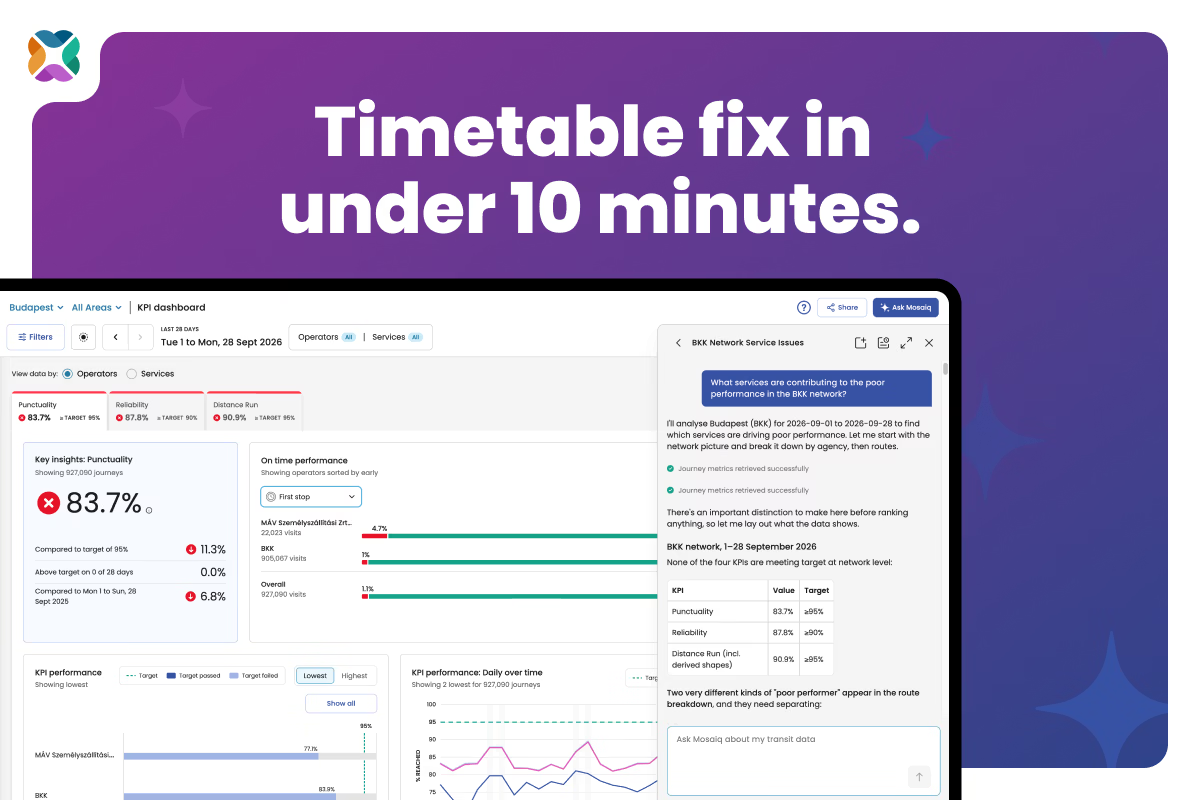
Distance reporting is now built into Mosaiq Insights. Performance managers can track how much ground buses are covering, and whether services are hitting their scheduled targets.
Filter by services and operators, and view distance run over time so you can confidently understand when and where reliability is dropping – and make the right fixes.
Previously, tracking distance meant spreadsheets, reference cards, or driving the route manually. That time is better spent on analysis.
Learn more about distance reporting.
Save time during analysis with new hide/show columns ability
Regularly scrolling sideways to find the data you want on the Operators or Services page? Our new hide/show column feature allows you to choose the columns you care about, and hide the rest.
Simply find the “Columns” button in the table view on the Operators or Services page, and select/deselect from the list of columns provided. Your choices determine what columns show on the page, and these choices will persist, even if you navigate away from the page and return.
Identify drifting services with new on-time performance indicators on the Running times page
We’ve also added on-time performance (OTP) indicators to the Running times page. Coloured tags indicate whether a running time is considered early (red), late (orange), on-time (green), or there is no available data (grey). New tooltips also include on-time performance indicators.
We’re already seeing positive feedback from users who need to diagnose the impact of running times variation on operations on the ground. As explained by Christian Heappey, Lead Strategic Customer Success Engineer at Optibus:
“The addition of the green/orange markers has made a really noticeable difference. It now tells a much clearer story when analysing running times, because you can see not only whether a trip or segment took longer/shorter than scheduled, but also whether the vehicle was actually early/on time/late at the relevant timing points.
This has already helped in a recent case I was looking at. Previously, the data showed the running time variance, but it was harder to explain the operational impact. With the new markers, it’s much easier to identify where the service is drifting from the timetable and to have a more informed conversation about whether the issue is runtime, dwell, schedule adherence, or something else.”
Learn more about OTP indicators for running times. [Link to KB]
Mosaiq continues to process the most bus data in the market
We crossed the milestone of 10 billion bus ‘heartbeats’ or GPS pings processed earlier this month – and now we’ve already crossed 12 billion! The huge amounts of information we process about buses across 31 countries gives us more context and helps to make your network's data more meaningful.
Stay connected
Want to be the first to know about the latest Mosaiq updates? Make sure to check our Release Notes regularly. To get monthly updates direct to your inbox, sign up to our mailing list.

.png)