Product news
How 10 billion heartbeats form the pulse of public transport
We process more than 10 billion real-world bus signals every month. Here's what that means – and why it matters for your network.

We process more than 10 billion real-world bus signals every month. Here's what that means – and why it matters for your network.

It’s a question we get a lot – what is a heartbeat? Everyone’s familiar with a heartbeat when we’re talking about the human body, but the meaning is less obvious when we talk about public transport.
Now that we’ve processed 10 billion of them in a month, it’s a good time to share a quick reminder of what a heartbeat is and why it’s valuable to public transport networks.
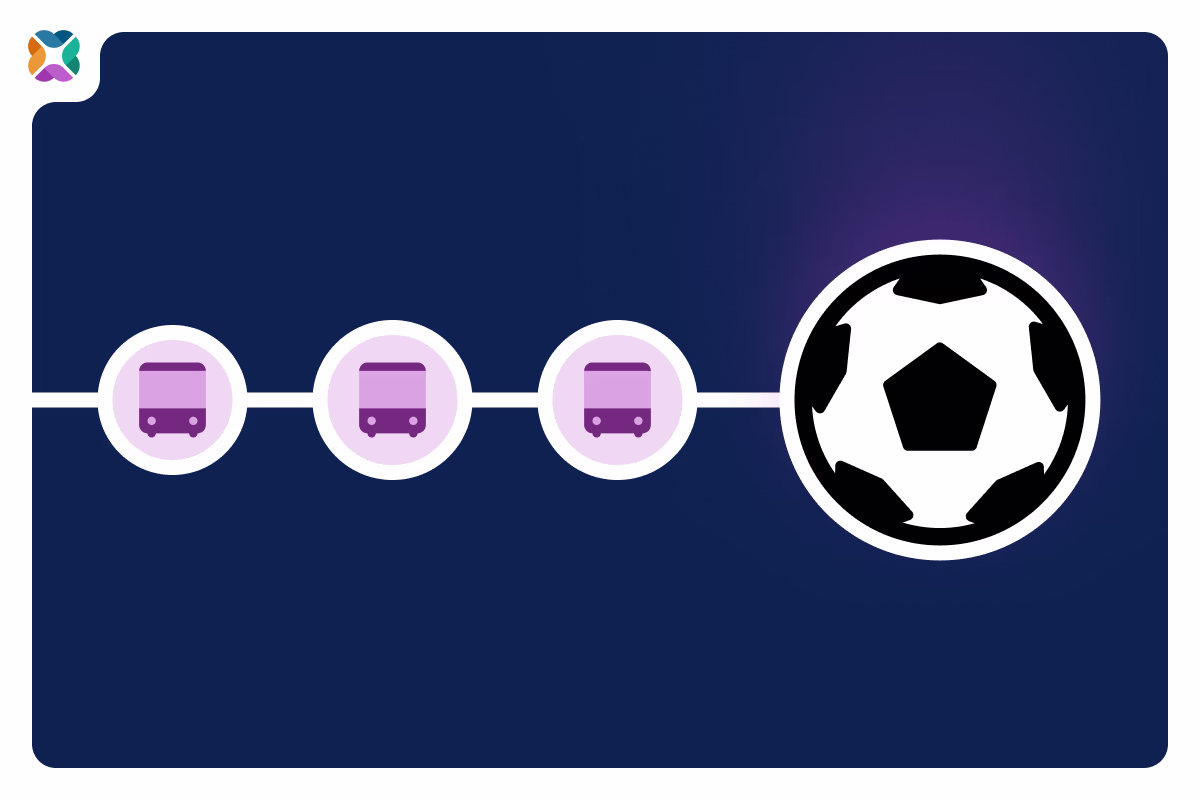
A heartbeat is a GPS ping from a vehicle in service. Every bus on your network constantly sends signals about its location and timing. We call these signals ‘heartbeats’.
A single bus in service might transmit one of these signals every 30 seconds. Multiply that across an entire fleet, every route, every day, across 31 countries – and the signals add up fast.
Tracking individual heartbeats at scale helps us to understand unpredictable, real-world transport globally.
Transit professionals aren't short of data. Most networks already have feeds pulling AVL, GTFS-RT, SIRI, RTPI, and more. The challenge most teams describe isn't a lack of data – it's being overwhelmed by it. It’s too hard to find opportunities for improvements when you’re drowning in the numbers generated by your fleet.
But volume is also what lets you understand why something happened – not just that it did. Heartbeat data fills in the gaps between stops. Do buses bunch on a particular stretch? Do they slow needlessly before a junction? Those questions are only answerable when you have enough repeated samples. The more heartbeats, the more accurate the picture.
So we're not trying to give you less network data. We're built to handle more of it – and to give you the visibility and context to make it mean something.
A delay that happens once is an anomaly. But if it repeats every Tuesday at 8:14am on the same stretch of road, it's a pattern. You only see the difference when you have enough data to tell them apart.
Anomaly
Bus 47 ran six minutes late on a Thursday afternoon. This could be due to bad traffic, a driver issue, or a weather event. On its own, this finding isn’t actionable.
Pattern
Bus 47 runs late every Tuesday and Thursday between 8:00–8:30am at the same stop. That indicates there’s a scheduling or infrastructure problem worth solving.
This large number is a reflection of the operational reality across Mosaiq’s global user community. It also means you can trust Mosaiq to handle your network data, no matter your size.
For planning managers and operations teams, this matters for a specific reason: the more data a transit intelligence platform has processed across diverse, real-world conditions, the better calibrated its patterns become.
High frequency urban routes, holiday timetables, event surges – Mosaiq has encountered all of it, across a range of networks and operating environments.
That depth of real-world exposure also matters for the broader transit ecosystem. Technology partners who build on top of historical data – route optimisation platforms, AI safety tools, scheduling systems – need data they can trust. A platform that has processed 10 billion heartbeats across real networks globally provides a strong foundation.
It's worth being precise about what 10 billion heartbeats actually gives you – because it's not simply more of your own data. The heartbeats Mosaiq processes come from networks across 31 countries. That cross-network data doesn't give any one user more signals from their own fleet. Instead, it makes your network's data more meaningful by giving it context.
Think of it the way you'd think about choosing a doctor with twenty years of clinical experience over consulting Google. The difference is pattern recognition built from exposure – from having seen enough cases to know which ones matter and why. Our Customer Success team works this way. When something unusual surfaces on your network, there's a reasonable chance they've seen something comparable before.
The transit network you actually run is messy. Delays and disruptions are inevitable. We've seen all of it – across every network type. When you bring us a problem, we're rarely starting from zero.
For planning managers, this means scheduling decisions grounded in patterns validated across their network. For operations teams, it means faster issue detection and clearer performance context. And for anyone evaluating transit intelligence platforms: the scale of data a platform has processed is one of the most honest signals of whether it's been tested by reality.
"The Mosaiq team is very good with data, they understand bus data and the real insights needed to improve bus operations, which is really valuable." – Sam Greaves, Commercial Manager at Liberty Bus
Mosaiq has seen enough real-world complexity to know what your network looks like before you do.
10 billion heartbeats. 31 countries. See what Mosaiq sees.
Let one of our team show you how we can help improve your transit network with Mosaiq. Set up a comprehensive, personal introduction for you and your team today.

Catch up on the latest Mosaiq news, industry updates, and thoughts from the Snapper Services team.


Lorem ipsum dolor sit amet, consectetur adipiscing elit. Suspendisse varius enim in eros elementum tristique. Duis cursus, mi quis viverra ornare, eros dolor interdum nulla, ut commodo diam libero vitae erat. Aenean faucibus nibh et justo cursus id rutrum lorem imperdiet. Nunc ut sem vitae risus tristique posuere.
Lorem ipsum dolor sit amet, consectetur adipiscing elit, sed do eiusmod tempor incididunt ut labore et dolore magna aliqua. Ut enim ad minim veniam, quis nostrud exercitation ullamco laboris nisi ut aliquip ex ea commodo consequat. Duis aute irure dolor in reprehenderit in voluptate velit esse cillum dolore eu fugiat nulla pariatur.
Block quote
Ordered list
Unordered list
Bold text
Emphasis
Superscript
Subscript
Let one of our team show you how we can help improve your transit network with Mosaiq. Set up a comprehensive, personal introduction for you and your team today.
Catch up on the latest Mosaiq news, industry updates, and thoughts from the Snapper Services team.