How Ask Mosaiq found the biggest problem on a network before my coffee went cold
Monday mornings at a public transport authority (PTA) often start the same way: coffee on, dashboards open and a scroll through the KPIs, looking for whatever's gone wrong. The process isn't hard, but it's slow, because the answer rarely sits on the first screen.
6 min read
8 October 2026
Our Product Manager Tamsyn Hilder put Ask Mosaiq, the new AI assistant in Mosaiq Insights by Snapper Services, to the test on a real public transport network. She asked the simplest question a planner might ask first thing on a Monday, then followed wherever the answers led – ultimately uncovering the biggest problem on her network before her coffee cooled. Here’s her investigation in her words, step by step.
Full disclosure: writing this up took longer than getting the answers!
The setup: one network, last 28 days
I used a real metropolitan network in Mosaiq Insights, with the KPI dashboard's default settings. To keep the focus on the method, I've renamed the network, operators, routes and stops after the fictional West Oxleyshire network, but every figure is real.
I didn't choose a problem to investigate first. I wanted to start from nothing and see how quickly Ask Mosaiq surfaced something worth investigating.
Four questions, no dashboard-building
I asked four plain-language questions about my network, each arising from the answer of the previous:
"How is West Oxleyshire performing?"
"Which routes are furthest below the network average?"
"Analyse Service 10 Lower Maple Lane – Grey Street."
"Where on Service 10 are buses falling behind?"
Every answer came back with the KPI figures, a data table, and links to the evidence in Insights. Nothing to export, join, or re-plot between questions.
What I found before my coffee cooled
All four headline KPIs sat below target across the network
Service 10 Lower Maple Lane – Grey Street was the clearest bus outlier: 37.5 percentage points below the network Punctuality average, across 876 scheduled journeys
Service 10's issue wasn't lateness. Nearly half of departures weren't detected at the first stop, and the inbound variant was where first-stop tracking drops out
Where buses were observed, they ran on time or early. The inbound run into Grey Street is a candidate for tightening running times, and the undetected departures warrant an investigation into how the data is captured
That's a specific, actionable network improvement in four questions.
Question 1: How is West Oxleyshire performing?
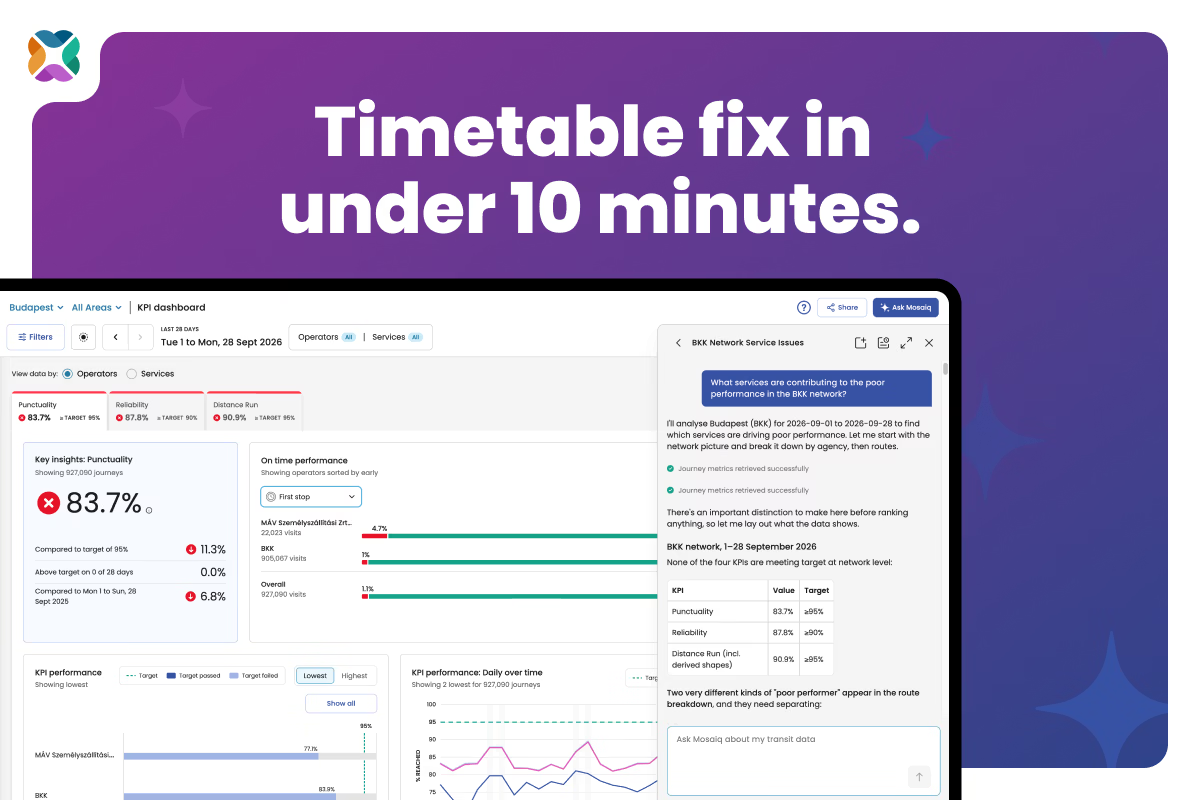
Ask Mosaiq returned network Punctuality, Reliability and Distance Run, already benchmarked against targets.
KPI
Value
Target
Gap from target
Punctuality
88.8%
≥95%
−6.2 pts
Reliability
82.0%
≥98%
−16.0 pts
Distance Run
88.1%
≥95%
−6.9 pts
It also added the context you'd expect from a colleague who knows the network:
Reliability is the biggest gap. Reliability measures whether a vehicle was seen at each timing point, so it reflects tracking coverage as well as service delivery. About 9% of scheduled journeys had no tracking data.
The gap is steady, not a recent dip. Punctuality held at 88–89% and Reliability at 81–83% week to week.
Useful, but I wanted to learn more.
Question 2: Which routes are furthest below the network average?
Instead of opening routes one by one, I asked Ask Mosaiq to do the comparison. It went a step further than a ranked list. It separated routes with meaningful volume from small school routes, where a couple of late trips swing the figure by tens of points.
Route
Operator
Punctuality
vs average
Scheduled journeys
Oxleyshire Valley Line
Oxleyshire Rail
18.8%
−70.0 pts
240
10 Lower Maple Lane – Grey Street
Oxleyshire Bus Company
51.3%
−37.5 pts
876
24 Kettle Hill – Harbourside
Oxleyshire Bus Company
81.4%
−7.4 pts
788
7 Brewers Green – Millbrook
Oxleyshire Bus Company
82.3%
−6.5 pts
1,876
3 Oxley Heights – Riverside
Oxleyshire Bus Company
83.7%
−5.1 pts
4,768
Two routes stood out. The Oxleyshire Valley Line had the largest gap, but Ask Mosaiq flagged that only 80% of its journeys matched to tracking data, so part of that gap is likely an observation issue on the line. Service 10 was the clearest bus outlier, with a sample large enough to trust.
I used to export this to Excel to weigh performance against volume. Ask Mosaiq did that weighing in the answer, so I stayed in the platform.
Question 3: Analyse Service 10 Lower Maple Lane – Grey Street
Ask Mosaiq opened with: "The headline number is misleading, and the detail explains why."
Here's the first-stop breakdown across 792 classified journeys:
On time: 51.3%
Late: 1.5%
Early: 0.1%
Not detected: 47.1%
The buses aren't leaving late. Nearly half of departures aren't detected at the first stop, and those undetected departures count against Punctuality. The same gap pulls down Reliability (56.3%) and Distance Run (65.5%). Mid-route, 90.2% of timing-point observations were on time.
The problem sits in one direction. On the inbound variant (Lower Maple Lane to Grey Street), only 25 of 428 scheduled first-stop departures were detected, compared with 378 of 428 outbound. That rate held at 47% every week. A pattern this steady points to a fixed cause, such as geofence placement or automatic vehicle location (AVL) dropout at the Lower Maple Lane origin stop, rather than a one-off disruption.
Question 4: Where on Service 10 are buses falling behind?
Ask Mosaiq's answer was direct: "Buses on [Service 10] are not falling behind anywhere that the data can confirm." Across roughly 40 stop positions, the late share peaked at 6.2%.
The real signal was the opposite of lateness. On the final inbound stretch into Grey Street, early arrivals climbed stop by stop:
Stop (order on route)
On time
Early
Late
Kettle Hill Rd (14)
72.5%
26.2%
0.3%
Brewers Green (15)
62.2%
35.7%
0.3%
Millstone Ave (16)
50.9%
46.8%
0.3%
Roaster's Corner (17)
43.4%
53.7%
0.3%
The timetable allows more running time than buses need on this stretch. That makes it a candidate for tightening running times, instead of fixing a non-existent delay. Ask Mosaiq also noted the segment samples are thin and recommended checking against scheduled times before acting – exactly the caveat you want before changing a timetable.
From an hour of clicking to four questions
The old way meant opening the KPI dashboard, moving to the Services page, exporting to Excel to check outliers against volume, then working through Service details and Running times to find where things break down. It's under an hour of work, but it’s still a decent chunk of time, and it means leaving the platform.
With Ask Mosaiq, it took four questions, asked as fast as they occurred to me. Each came back with the figure, the context to read it, and the next place to look. It's like asking a colleague who knows the network inside out, and getting the answer just as fast.
“Mosaiq cuts down a lot of our investigative work. It's just there for us. So it helps me clean my desk quicker." — Christopher Wood, Transit Operations Manager, Montebello Bus Lines
Want to be the first to know about the latest Mosaiq updates? Make sure to check our Release Notes regularly. To get monthly updates direct to your inbox, sign up to our mailing list.
Catch up on the latest Mosaiq news, industry updates, and thoughts from the Snapper team.
Request a demo
Let one of our team show you how we can help improve your transit network with Mosaiq. Set up a comprehensive, personal introduction for you and your team today.