For most rural operators and local transport authorities, who don't have the dedicated analytical resource that larger urban networks take for granted, the answer is likely no. And that gap shapes what decisions get made, what funding gets justified, and what services survive.
Nearly one in five rural bus routes in England disappeared between 2019 and 2024. Bus boardings outside London remain at 85% of pre-pandemic levels. The policy response is welcome - and it can be further supported through better data infrastructure.
What the on-time performance data shows
The Global Public Transit Index (GPTI) draws on open, real-time vehicle location data from more than 1400 locations worldwide. In the United Kingdom, the top 10 locations by on-time performance – each with over 50,000 trips tracked – give a sense of what good looks like at scale.
Top 10: First stop on-time performance (50k+ trips tracked)
| Rank |
Location |
On-Time Performance (%)
OTP (%)
|
| 1 |
Belfast |
94.0% |
| 2 |
Stockport |
93.6% |
| 3 |
Leeds |
93.0% |
| 4 |
Bournemouth |
92.9% |
| 5 |
Bradford |
92.8% |
| 6 |
Trafford |
92.5% |
| 7 |
Wigan |
92.4% |
| 8 |
Walsall |
92.3% |
| 9 |
Wolverhampton |
92.3% |
| 10 |
Manchester |
92.1% |
Source: Mosaiq by Snapper Services GPTI. Data period: 4 May–31 May 2026.
Notice that regions that appear in the Rural Bus 2026 programme are missing. Cambridgeshire tracked 65,630 trips over the period at 89.4% on-time. North Yorkshire tracked 57,341 trips at 90.0%. Cornwall tracked 53,060 trips at 85.3%. They logged enough trips to be eligible for the ranking, but their on-time performance didn't make it into the top 10.
Across smaller networks (as measured by tracked trip number), the picture is wider still, with nearly 14% separating the best small locations from the worst across the UK.
Top 10: First stop on-time performance – smaller networks, UK
| Rank |
Location |
Country |
On-Time Performance (%)
OTP (%)
|
| 1 |
Blackpool |
England |
94.7% |
| 2 |
Rutland |
England |
94.5% |
| 3 |
Antrim & Newtownabbey |
Northern Ireland |
94.1% |
| 4 |
Armagh City, Banbridge and Craigavon |
Northern Ireland |
94.1% |
| 5 |
Blackburn |
England |
94.0% |
| 6 |
Fermanagh and Omagh |
Northern Ireland |
93.9% |
| 7 |
Mid Ulster |
Northern Ireland |
93.7% |
| 8 |
Newry, Mourne and Down |
Northern Ireland |
93.5% |
| 9 |
Isle of Wight |
England |
93.2% |
| 10 |
Torfaen |
Wales |
93.2% |
Bottom 10: First stop on-time performance – smaller networks, UK
| Rank |
Location |
Country |
On-Time Performance (%)
OTP (%)
|
| 1 |
Monmouthshire |
Wales |
81.0% |
| 2 |
Vale of Glamorgan |
Wales |
81.0% |
| 3 |
Torbay |
England |
82.5% |
| 4 |
Pembrokeshire |
Wales |
83.3% |
| 5 |
Shropshire |
England |
83.9% |
| 6 |
Gwynedd |
Wales |
84.8% |
| 7 |
Milton Keynes |
England |
85.0% |
| 8 |
Somerset |
England |
85.3% |
| 9 |
Powys |
Wales |
85.4% |
| 10 |
Central Bedfordshire |
England |
85.9% |
Source: Mosaiq by Snapper Services GPTI. Data period: 4 May–31 May 2026.
Two patterns stand out. Northern Ireland dominates the top 10, with five of the ten best-performing smaller networks – mirroring Belfast's lead in the large network table. Wales tells a different story: five of the ten lowest-performing smaller networks are Welsh, including the two lowest in the entire dataset. That sits alongside Wales's slower passenger recovery – as at March 2024, bus numbers there remained at 78.3% of pre-pandemic levels, below both England and Scotland – and gives added urgency to the Welsh Government's move towards franchising.
The missing distinction: rural vs urban
These figures are organised by location and trip number, which means rural and urban routes within the same location are measured together. The GPTI doesn't yet disaggregate by route character (urban vs rural). That's the gap, and it means we can’t easily see and report on rural bus network performance in the UK at scale. Getting networks into a consistent benchmarking framework is the first step.
Why data visibility matters for rural bus services
Rural bus connectivity has two dimensions, and both need data. The first is coverage: where are the gaps, which communities are underserved? The second is performance: for the services that exist, are they running reliably? These questions are harder to answer than they should be.
BODS – the Bus Open Data Service – requires all operators in England to publish timetables, fares, and real-time location data. Its companion service, ABODS, provides free repoorting. In principle, every operator has access to performance data. In practice, ABODS is only as good as the data fed into it. Smaller operators with irregular services – school holidays, seasonal routes, demand-responsive variations – are most at risk of incomplete feeds, and most in need of the insights the system is designed to provide.
The Public Accounts Committee put the broader problem plainly in its October 2025 report: patchy implementation of technology has led to a variable experience for passengers across the country. Fewer than one in six bus users has live updates at their bus stop. If the national picture is that uneven, smaller rural networks – with less resource and less political leverage – are likely to be on the wrong side of that gap.
Performance data is one of the few tools that can make the case for rural services credibly. If you can show a route is running reliably, meeting its timetable, completing journeys as planned – that's evidence that holds up in a funding conversation. Without it, operators are left arguing with only anecdote as evidence.
Improve your understanding of your network’s performance
The programme in Chester this month covers franchising pilots, DRT, planning policy, and social value – all evidence-dependent conversations. You can't evaluate a DRT pilot without performance data. You can't make a franchising case without a baseline. The Bus Services Act's new powers are only as useful as the data local authorities can bring to bear in exercising them.
There are two practical things operators and authorities can do right now.
The first is to get your network into the GPTI – adding your data means your performance is visible, benchmarked against comparable networks across the UK, and part of the public record.
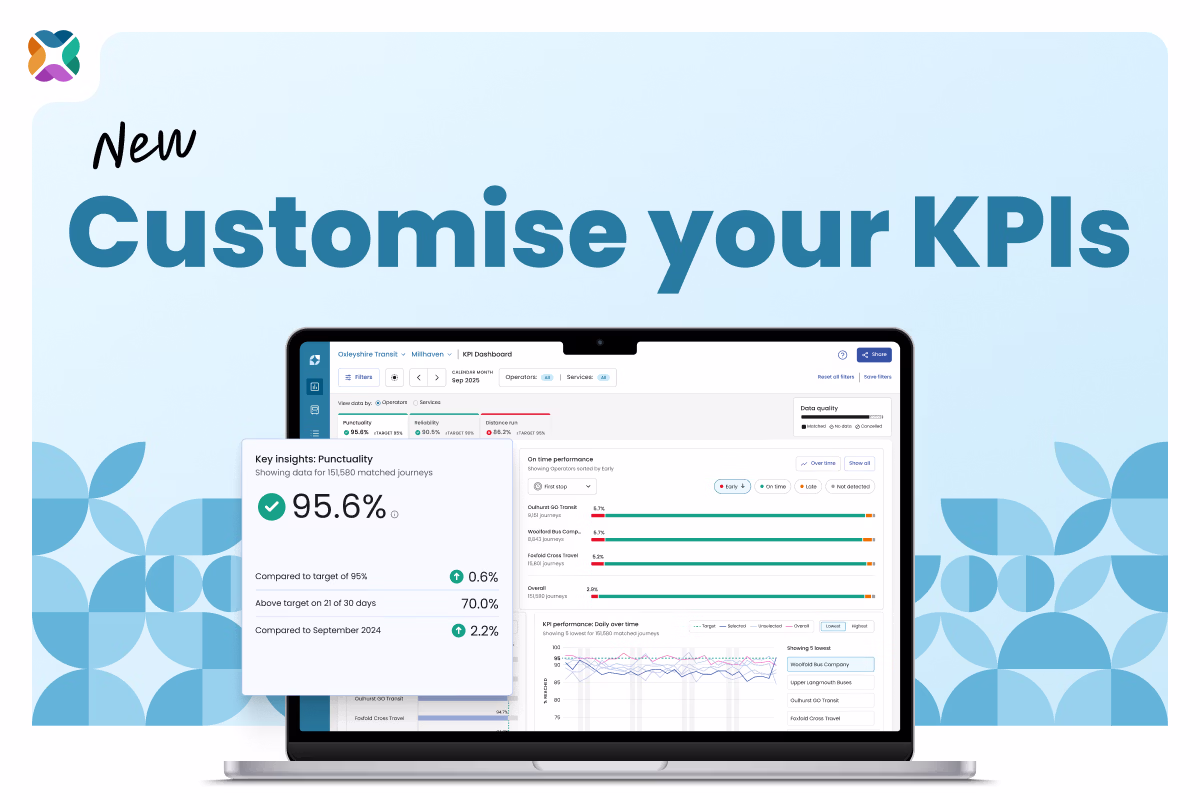
The second is to trial Mosaiq Insights, which gives you route-level, stop-level performance analysis on your own network: what's running late, where, and when.
Explore the data
Use the public GPTI to look up any UK location, compare areas, and see first-stop on-time performance, constantly refreshed.
Not seeing your data in the GPTI? We can add your network at no cost, allowing you to compare performance and explore Mosaiq Insights for deeper analysis and actionable improvement opportunities. To add your network to the GPTI or trial Mosaiq Insights, get in touch.
Mosaiq by Snapper Services is a transit intelligence platform used by public transport operators and authorities across New Zealand, Australia, the UK, and North America. The Global Public Transit Index (GPTI) draws on publicly available transit schedules and real-time “open” data from locations worldwide. We acknowledge Mobility Database for championing open data globally.