The US federal government knows this, and earlier this year provided $100 million in funding to help host cities prepare. This funding assists with infrastructure and planning costs, as well as the operating costs of public transport. Fans who want to drive to matches are facing severely reduced (and expensive) spectator parking at most venues, and international visitors won’t have their own cars, meaning that public transport is poised to be the travel mode of choice.
So, for most host cities, buses are a key piece of the puzzle.
But these buses won’t be carrying their normal passengers. They will serve thousands of fans per match day, many of them visitors unfamiliar with local networks. Combine this with increased security measures and never-before-seen congestion, and the reputation of these authorities and operators is at risk.
The planning is done. Now comes the real test.
What the data shows - and what it doesn't
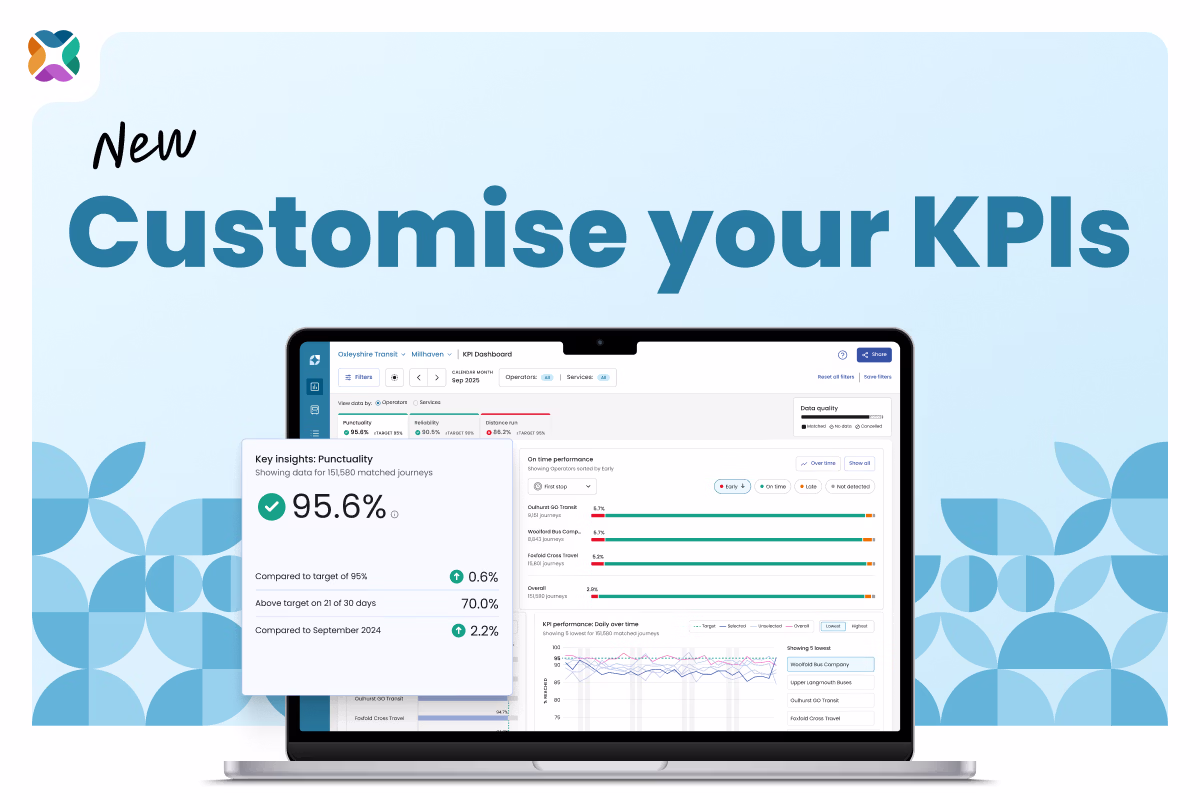
An event of this scale is a huge opportunity to assess the performance of bus networks under strain. We’re interested in how host cities are performing through the lens of the Global Public Transit Index (GPTI) – our free, open-data benchmarking tool that tracks bus on-time performance across more than 1,000 locations worldwide.
Eight of the 16 host cities publish open data that makes GPTI coverage possible:
- Los Angeles
- New York
- Philadelphia
- Atlanta
- Seattle
- San Francisco
- Vancouver
- Toronto
For those cities, the GPTI gives us a live, independent view of how their bus networks are actually performing. As the tournament progresses, that data will show whether expanded services are holding up under match-day pressure, whether reliability is improving as frequencies tighten, or whether the sheer volume of demand is starting to have an impact on performance.
The problem of data visibility - or invisibility
The other eight FIFA host cities don't appear in the GPTI at all.
Dallas, Houston, Kansas City, Miami, and Boston – five of the 11 US host cities – don't publish the open transit data feeds that would make them visible in the index. Neither do Guadalajara, Mexico City, or Monterrey. That's every Mexican host city and almost half of those in the US.
Dallas is the starkest case. Around 12,000 fans per match are expected to travel partway to AT&T Stadium via Dallas Area Rapid Transit (DART). Fans will catch trains to a central station before walking the last stretch of the journey. Dallas' public transport data isn’t open, so it doesn't appear in the GPTI. As a result, the city hosting nine World Cup matches, including the first semi-final, will miss out on an opportunity to see where their public transport performance ranks globally.
Why this matters beyond the tournament
The World Cup runs until 19 July. But the lessons about how these networks perform under pressure will inform their evolution long after the final whistle.
For the eight cities visible in the GPTI, this tournament is a live stress test with independent measurement. They can see how their bus networks respond to this surge in demand in real time, compare their performance against global peers, and build an evidence base for future investment decisions.
For the eight that aren't visible, the tournament will still progress and fans will get to stadiums. But the opportunity to benchmark their performance against peers will be lost.
Over the next four weeks, we'll be tracking what the GPTI shows across all eight covered cities: which networks are holding up, and which are showing signs of pressure.
We look forward to sharing these insights with the wider public transit community so that we can all learn together for future events.
Read the next article in the series: Atlanta, Seattle, Los Angeles: what the GPTI shows about bus performance on FIFA match days
See how your bus network performs against global peers. Explore the Mosaiq Global Public Transit Index – free for all transport authorities and operators. Can’t see your network? We’ll add it for you - just get in touch.
Stay connected
Want to be the first to know about the latest Mosaiq updates? Make sure to check our Release Notes regularly. To get monthly updates direct to your inbox, sign up to our mailing list.