Understanding the distance your buses cover is also crucial to performance reporting and understanding whether you are compliant with contract requirements. Lost mileage can lead to financial penalties and make your operation less profitable.
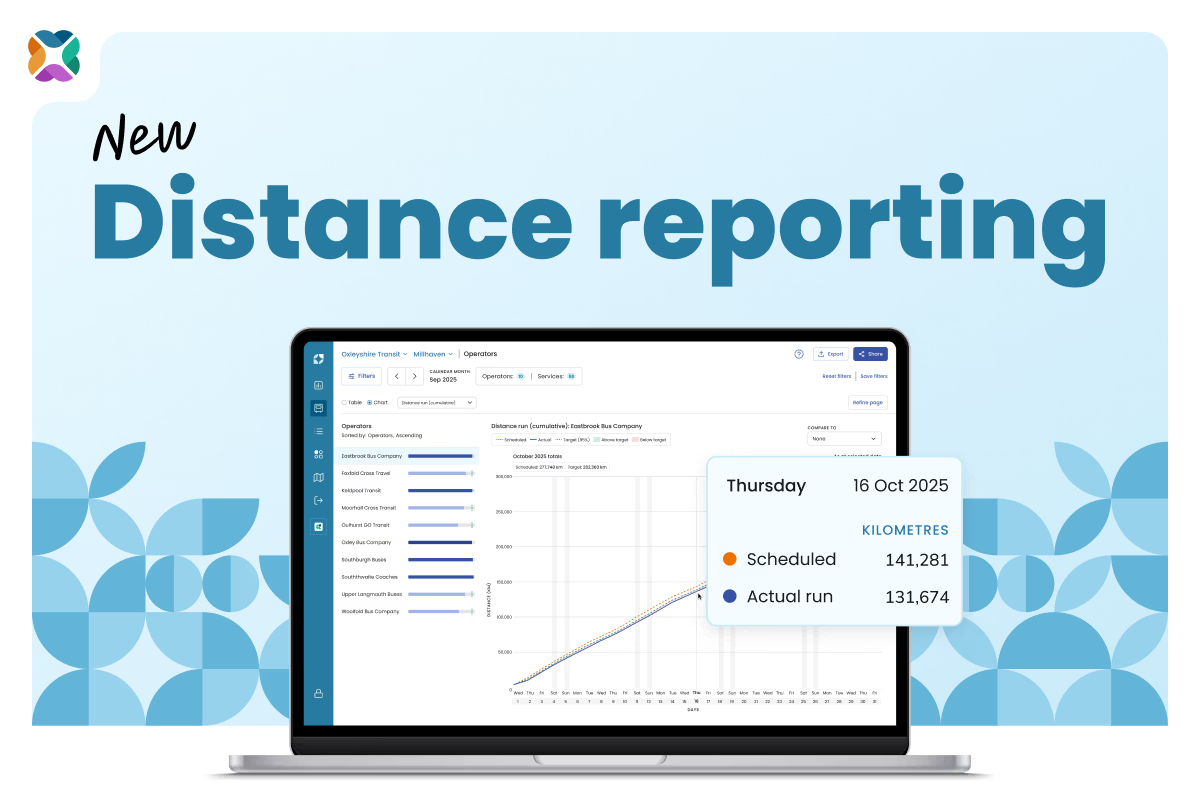
To tackle these problems and improve service reliability, the new distance reporting feature in Mosaiq Insights tracks the distance your buses run and whether they hit their scheduled targets.
You can see how much ground your buses are covering at a glance with simple charts; filter by services and operators; and view distance run over time so you can confidently understand when and where reliability is dropping – and make the right fixes.
What is lost mileage?
Lost mileage (also referred to as lost kilometres) is the distance your buses have been scheduled to run but have not actually travelled.
It’s an important measure of the reliability of your bus network, and is also a key cause of financial penalties.
Some important definitions
Note: In Mosaiq, we define “lost mileage” as the distance your buses have been scheduled to run but have not actually travelled within revenue service.
However, the term used for the distance scheduled but not travelled can vary between operator and country.
- Some operators refer to “lost mileage” as the distance traveled outside of revenue service.
- Other operators use “short working” in the same way we use “lost mileage”, i.e. the bus did not travel its full scheduled distance within revenue service.
- “Curtailment” is a term used in the UK to describe a bus journey being terminated early, often to address issues like congestion or driver shortages, to get a bus back on schedule.
- In the US, “lost mileage” may also be referred to as “short running” or “missed trips”.
All of these terms refer to situations in which the ultimate outcome is decreased reliability and a deficit between scheduled distance and actual distance travelled.
Trips are often not run due to operator shortages. For example, post-COVID, some routes in Baltimore, Maryland, saw 1 in 5 scheduled trips simply not run.
Consequences of lost mileage
When a trip is cut short or never started, the gap between buses on the route suddenly grows. There are more passengers at the stop by the time the next bus arrives, meaning that bus then becomes overloaded and slow, creating a “bunching” cascade. This is common on high-frequency routes in cities like New York, where more than 50% of frequent bus lines are delayed due to bunching.
Lost mileage can have significant social and economic consequences, contributing to inequality. Unreliable bus networks can cost people their jobs, and limit education and healthcare access. Commuters also absorb a ‘time tax’, meaning they need to get to bus stops earlier to avoid missing their bus – something people with private vehicles don’t have to do.
Lost mileage also has financial consequences. In the UK, the traffic commissioner can block you from running an unreliable service – or any services at all. The commissioner can also fine you, proportional to the number of vehicles in your fleet, and you may be required to spend money on improving the services or compensating passengers. In the US, the San Diego MTS fines contractors $1,000 each time they inaccurately report missed mileage or fail to report a missed trip.
Poor reliability also impacts your funding chances. In the US, agencies receiving federal funding must report service delivery data to the National Transit Database (NTD). Reduced Vehicle Revenue Miles (VRM) may affect funding allocation.
All in all, poor reliability sets you up for the “reliability death spiral”, where trips are missed, passengers abandon route, ridership falls, funding is cut, and you see more missed trips as a result.
Why is distance reporting important to network performance?
Day-to-day, you’re grappling with manual reporting and incomplete data. Together, these lead to a lack of network insight: it’s hard to tell which services and operators are meeting or falling short of target.
It’s nearly impossible to know where to make changes in the network for the best impact, or to report on your performance to stakeholders.
Designed to solve these problems, distance reporting supports many of your key workflows, including validating performance, meeting contractual requirements, and keeping operators accountable.
With new distance reporting, you can:
- identify service under-delivery
- monitor distance trends across the network
- report operated distance by service or operator
- verify contractual service levels
- argue for changes to network and evaluate effects post-change
Proving service delivery when conducting performance reporting
By using distance charts (actual run vs scheduled) you’ll immediately see when buses aren’t meeting their scheduled distance targets. Once you’ve identified a problem, you can act quickly and confidently to improve reliability and meet contract compliance – without simply putting more buses on the road.
To better diagnose your distance issues, you can filter by operator or service. This helps you better understand operational efficiency and make targeted interventions for maximum impact. You can also use this data to have evidence-based discussions with operators, improving accountability.
Distance reporting is also a useful tool when you are seeking to understand how performance has been impacted by timetable changes, driver shortages, and other disruptions.
Validating kilometres operated for contract and funding compliance
You can view distance analytics in a few ways in the new reporting function:
The Distance KPI: Daily over time widget gives you an at-a-glance summary of the five highest- or lowest-performing operators distance performance daily over time.
The Distance performance widget highlights the five highest- or lowest-performing operators or services, ranked either by distance run as a percentage of scheduled distance, or by total scheduled distance. You can toggle between percentage and kilometre views to suit your needs. From the widget's overflow menu, you can navigate directly to either of the two detailed chart views below.
The Distance: Daily over time chart shows daily distance data for operators or services over your selected period of time.
The Distance: Cumulative chart shows a burn-up style view, showing scheduled and actual distance accumulating over your selected period for your selected operator or service. In the sidebar, you can hover over a specific operator or service's distance bar to see the total distance run, lost mileage, and variance from the target.
This makes it easy to see whether your buses are covering the distance they are scheduled for, and to visualise how any distance gap (above or below target) has developed over time.
Finally, four new columns have been added to the Operators and Services table views, so you can easily understand how each operator or service is performing:
- Distance run
- Scheduled distance
- Actual distance
- Lost mileage (the gap between the two)
These simple charts and table additions will allow for more effective performance reporting. You’ll feel more confident reporting to authorities and funding bodies, and have a clearer understanding of how you’re performing relative to contract requirements.
Tracking distance performance against target
If you have a target set out in your contract for actual distance run compared to schedule, then you can monitor this in Mosaiq. By default, the target will be 95% of scheduled distance. This is a common target in the industry, but some contracts are evolving to be stricter. For example, Bus Éireann in Ireland moved from a 5% maximum lost kilometre rate (2017–2018) to a stricter 2% maximum lost rate from 2020 onwards.
If your target is different from 95%, you can contact our friendly team to ask for the default to be changed to suit your contractual obligations.
Note: Distance reporting does not affect the overall “Reliability KPI” in Mosaiq.
Where can I find distance reporting in Mosaiq?
Distance reporting widgets can be found in the reliability tab of the Insights KPI screen, for both operators and services.
You can also see a table view on the both the operators and services pages. From there, you can toggle to chart view and view the Distance overtime and the Cumulative distance chart.
Distance reporting requires specific data
To enable distance reporting, you’ll need to provide shape_dist_traveled in either the shapes.txt or stop_times.txt files within your GTFS upload. This provides the distance between first and last recorded stops, and allows Mosaiq to calculate distance metrics.
If you are unable to provide a shapes file, we will derive shapes. We do this by using heartbeats in a section to work out the path a bus takes between stops. With this data, we can calculate the shape and thus distance. Derived shapes ensure not just speed and completeness, but also objectivity. The system removes the bias that humans inevitably apply when filling gaps.
Stay connected
Want to be the first to know about the latest Mosaiq updates? Make sure to check our Release Notes regularly. To get monthly updates direct to your inbox, sign up to our mailing list.


.avif)