With 56% of New York City’s population reporting that they use public transportation regularly, the performance of the public bus network is crucial to the city’s liveability, resident satisfaction, and economic output. Almost 60% of people using public transit are commuting, and a huge majority (83%) of older Americans say that public transit gives them easy access to things they need for everyday life.
It’s obvious that the punctuality and reliability of the city’s buses is crucial to urban life. So how are the state's networks actually performing?
Note that the New York City Subway, operated by the Metropolitan Transportation Authority (MTA), is not included in this analysis.
How do bus networks perform in New York state?
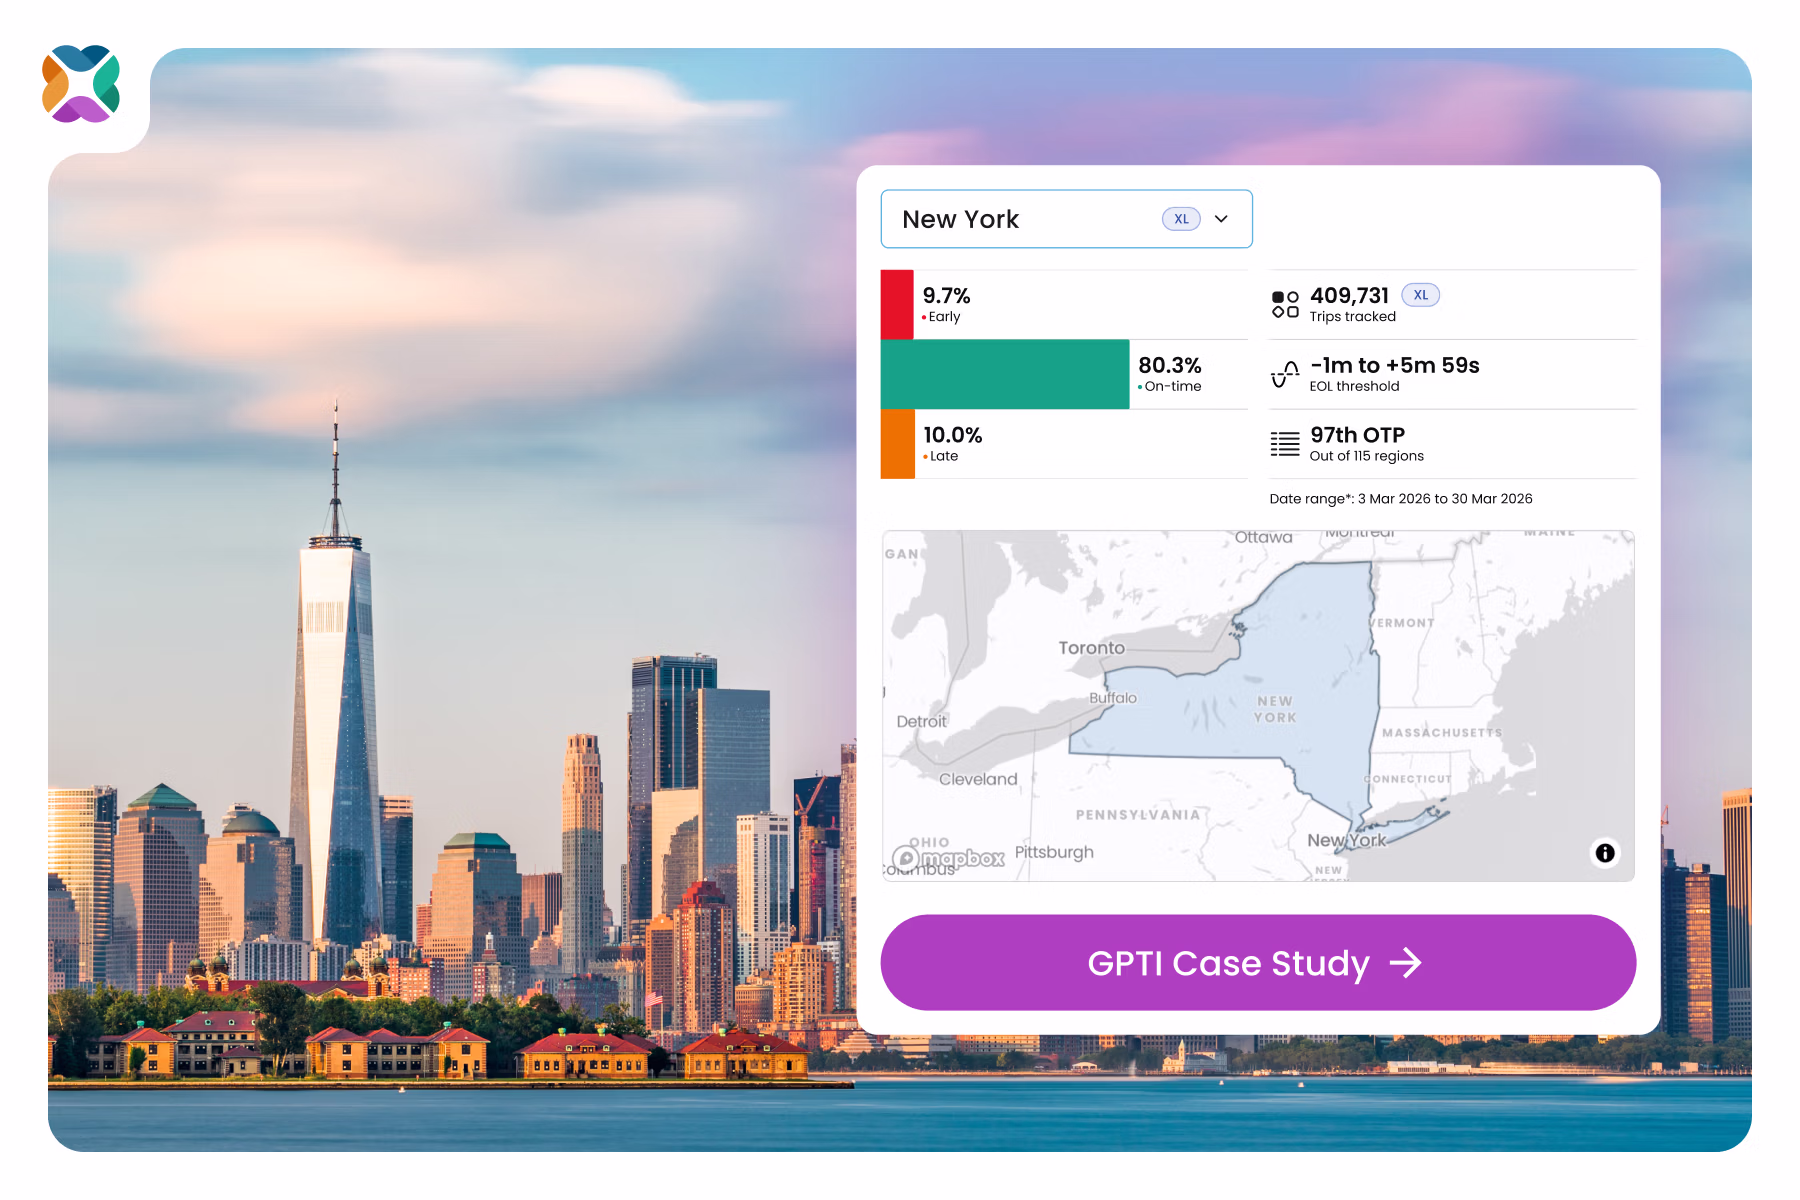
Across the 15 tracked networks within the region, there were 398,249 trips recorded in open data sources between February and March 2026.
9.6% of these trips were early at the first stop (by more than 1 minute) – meaning almost 1 in 10 trips misses out on collecting passengers who are waiting at the right time at their stops.
But earliness is not the only problem. 11.4% of trips in the state were late by more than 5 minutes and 59 seconds. Lateness has flow-on effects throughout the network, meaning passengers may miss subsequent trips in their journey.
It’s likely that New York sees a lot of bus bunching or clustering: a phenomenon where buses scheduled at regular intervals arrive at a stop at the same time, due to traffic and initial delays.
Consistent issues with earliness and lateness degrade the reliability of the network – the likelihood that the bus will be at the stop for which it has been scheduled. Poor reliability causes passengers to lose trust in the network, and may lead to a decrease in ridership.
Certainly, there is increased risk of missing contractual targets, and incurring financial penalties. When combined, these consequences represent a significant financial risk for the networks.
Overall, only 79.1% of these almost 400,000 trips were recorded as on-time, representing a huge opportunity to improve service reliability in the network.
Discover New York’s data in the interactive Global Public Transit Index
How do the different areas in New York perform?
On-time performance
The best-performing public transportation network in New York in terms of on-time performance (OTP) is Rensselaer county, at 94%.
Rensselaer county boasts a population of ~160,000, and is recognised as one of the fastest-growing metropolitan areas in New York state. 11.2% of the county’s residents live in poverty, with a median household income (in 2024 dollars, 2020–2024) of USD$87,915. The region sits at the heart of “Tech Valley”, a hub of technological and educational innovation, and is largely served by the Capital District Transportation Authority (CDTA). The CDTA operates across multiple counties, meaning that its performance may benefit from efficiencies of scale and a more urban infrastructure.
At the other end of the spectrum, Putnam county has the worst on-time performance, at 65.6%. This is a rural county with a smaller population (~98,000), and interestingly has more positive demographics than Rensselaer, despite that county’s better network performance. In Putnam, 6.8% of residents live in poverty and the median household income (in 2024 dollars, 2020–2024) was USD$126,257.
Putnam Area Rapid Transit (PART) operates a range of services in the county, including local fixed route, commuter shuttle, trolley, on-demand microtransit, and paratransit. The county’s public transit system is currently under review, with the Putnam County Department of Planning, Development and Public Transportation evaluating existing services through to June 2026.
Both neighbourhoods have lower poverty rates and higher median incomes than the New York state average. It’s unclear why Putnam’s performance is so poor: but one reason may be that many of its routes operate with a flag-stop system, meaning passengers can flag buses down anywhere along the route (including outside of designated stops). This would cause variability in the bus schedule and may introduce compounding delays.
Early arrival
In addition to its lower on-time performance, Putnam also has the most early arrivals, at 29.5%. This makes sense within the context of flag-stop operations.
This is in comparison to Tompkins, with bus services provided by Tompkins Consolidated Area Transit (TCAT) resulting in 1.1% early arrivals. Tompkins is the lowest-earning of the counties assessed so far, with a median household income of USD$74,024 and 17.3% of the population living in poverty. Unfortunately, although Tompkins is the highest-performing network in terms of early arrivals, this is because it has the most late arrivals (24.3%).
“Countless times, I’ve checked the arrival schedule only to get to the stop and find out the bus is delayed an extra 10 or 15 minutes. Those extra minutes matter when you’re standing in the cold or rushing to class.” said a Cornell University student served by TCAT, in a Cornell Sun article.
Late arrival
Tompkins high rate of late arrivals could be explained by a strict contract with Cornell University that required the TCAT to pay the university penalties for underperformance, meaning less cash to pay drivers, maintain vehicles, and improve performance in the future. TCAT has suffered from a driver shortage and decreased ridership since the pandemic, and its electric bus fleet underperforms in their cold winters.
Rensselaer county continues to shine as the New York network with the fewest late arrivals, at 3.7%.
To learn more about the 15 state networks we have analyzed, search “New York” in the GPTI.
How does New York’s bus network compare to other extra-large regions throughout the world?
We classify the New York region as an “extra-large” (XL) network, meaning that it exceeds the threshold of 280,000 or more matched trips in 28 days. it is most reasonably compared to other XL regions, whether those are cities or entire countries.
Overall, New York is performing poorly compared to its “extra-large” regional peers, with the 99th best OTP out of 114 regions worldwide.
Compare New York’s OTP of 79.3% to the best-performing XL regions, for example – with the Czech Republic (97.2%), Lithuania (96.5%), and New Zealand (95.9%) rounding out the top spots.
What could improve New York’s bus network on-time performance?
- In counties like Putnam, consider investing in infrastructure for more designated stops and move away from a flag-stop model.
- Updating schedules to account for local geography (are you operating in hilly, rural environments, like in Tompkins, or flat, dense, urban environments?)
- Resist cancelling services at all costs – cancelled services lead to decreased ridership and thus to less funding, kicking off the “reliability death spiral”.
- Where possible, renegotiate funding contracts for short-term leniency to get back on track.
- Evaluate whether electric buses will work in your local geography and weather conditions: in Tompkins, electric buses require 48% more energy in cold weather to heat their batteries and maintain cabin temperatures, effectively reducing their range.
It’s clear that within a state, different counties see wildly different on-time performance. That’s why it’s crucial to have clear visibility into your network’s metrics, so you understand operators and services at a granular level. Without the data, you won’t know what changes to make. Learn about your network’s performance in the free, interactive Global Public Transit Index today, and see how you compare to your peers.
Date ranges: 18th February, 2026–17th March, 2026; 25th February, 2026–24th March, 2026.
Open data sources: The Mosaiq Global Public Transit Index uses publicly available transit schedules and real-time “open” data from locations worldwide. We acknowledge Mobility Database for championing open data globally.