That’s why transit professionals are increasingly turning to headway – the time interval between vehicles – and excess wait time (EWT), which measures how much longer passengers wait compared to the ideal schedule. These metrics give a clearer view of service performance from the passenger’s perspective and reveal insights that standard on-time performance measures often miss.
With the right data and tools, operators can identify where reliability breaks down, understand the causes of delays, and take action to improve the passenger experience.
What makes high‑frequency services different
On lower‑frequency routes, performance is typically assessed by whether a vehicle departs within an “on‑time” window, for example, a bus is considered on time if it leaves up to one minute early or six minutes late. However, this approach doesn’t translate well to frequent services, typically defined as 6 or more buses per hour.
When services are scheduled every few minutes, passengers don’t plan around a timetable; they expect regular spacing between vehicles. Yet small delays on a frequent route can quickly compound. If two buses arrive back‑to‑back after a gap, passengers may perceive the service as unreliable even if each bus was technically “on time.” This is where headway and excess wait time (EWT) become far more meaningful performance indicators than punctuality alone.
Understanding headway and Excess Wait Time
Headway refers to the interval between consecutive vehicles on the same route. It shows how consistently vehicles are spaced and directly affects the waiting experience for passengers.
Excess wait time (EWT) is the additional time a passenger waits beyond what they should expect on a perfectly spaced service. In other words, if the service is scheduled every 10 minutes, EWT captures how much longer passengers are actually waiting compared to that ideal.
Together, headway and EWT offer a more accurate picture of frequent service reliability because they focus on what really matters to passengers: consistent spacing and minimal unexpected wait times.
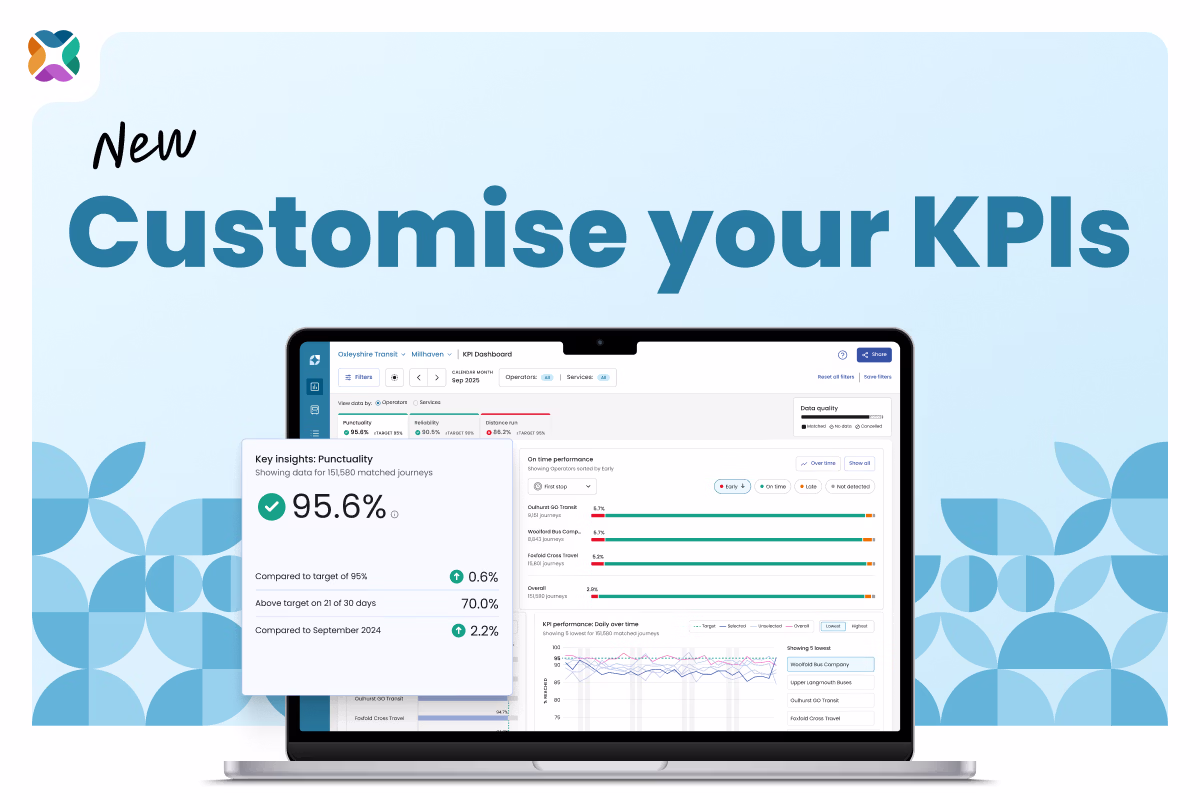
How Mosaiq helps you understand frequent service performance
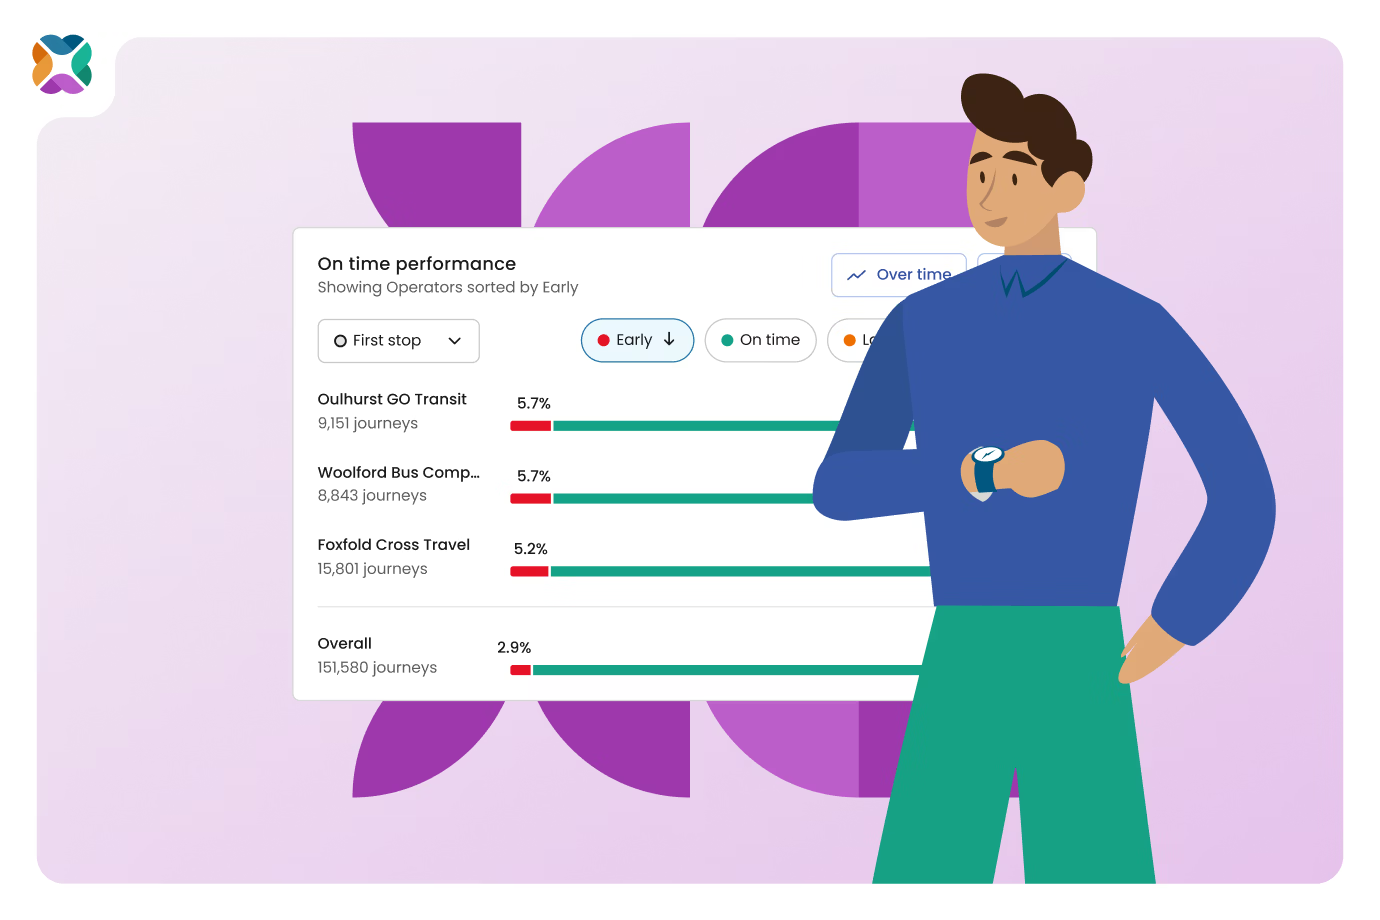
Mosaiq collects detailed stop‑level data across a network, giving planners, operators, and analysts the information they need to evaluate how services run in the real world. While frequent services aren’t evaluated using traditional on‑time windows, Mosaiq provides the insights needed to:
- Observe actual headways along a route and compare them to scheduled intervals
- Identify where larger than expected gaps occur, even when vehicles are technically on time
- Detect patterns that cause passenger wait times to increase at specific locations
By focusing on stop-level performance, Mosaiq helps transport teams understand reliability from the perspective of the passengers, not just the schedule.
A practical example: high‑frequency airport service
A high-frequency airport service running every 10 to 15 minutes on weekdays highlights the value of headway and EWT analysis. On the surface, the service looks reliable: actual headways closely match the schedule, and passengers experience less than a minute of excess wait-time on average. By conventional punctuality metrics, everything seems on track.
However, when performance is examined stop-by-stop, a different picture emerges. At one timing point along the route, passengers were consistently experiencing longer waits than expected, with excess waiting times nearing two minutes. This was not driven by unusually long travel times leading into the stop, which suggests that small delays were accumulating at that location.
Without headway and excess wait time analysis, this issue would have been hard to spot using punctuality metrics alone. Looking at the data in detail allows transport teams to identify localised reliability problems that are hidden by overall averages.
Why this matters for decision‑makers
For transport planners and network operators, understanding headway performance has real operational value. It can help identify where service reliability is breaking down, show where interventions will have the greatest impact on passenger experience, and distinguish between issues caused by scheduling and those caused by operational constraints.
Rather than relying solely on broad punctuality measures, authorities and operators can use headway and EWT analysis to prioritise improvements and track whether changes are improving passenger wait experiences.
Looking beyond “on-time”
High‑frequency services require a different perspective on performance, one that reflects how passengers truly experience the service. By combining stop‑level data with headway‑centric analysis, authorities and operators can move past traditional on‑time performance metrics, better suited to low‑frequency environments.
Mosaiq is designed to support this advanced, passenger-focused analysis, giving decision-makers confidence in their data and the flexibility to explore performance in ways that matter most to passengers.
If you’d like to learn more, you can explore Mosaiq Insights or contact our team to see how Mosaiq supports high-frequency service analysis.