Unlike platforms that simply display the data as it’s received, Mosaiq applies a series of validation and cleansing processes to ensure that every dataset is accurate, consistent, and ready for analysis. This means that what you see in Mosaiq truly reflects network performance, without the noise, duplication, or inconsistencies often found in raw feeds.
What data quality means
Public transport networks are complex, with vehicles, stops, schedules, and real-time feeds all needing to work together. Data quality measures how well these components align and ensures the insights you see reflect reality.
In Mosaiq, trips are classified as matched when at least one vehicle heartbeat aligns with the scheduled journey. Trips that aren’t matched fall into one of two categories: cancelled, meaning the service didn’t run at all, or no data, which indicates that vehicle movements weren’t observed or there were gaps in data collection.
High-quality data helps you answer questions such as: Did a trip run on time? Were all stops served? Which services or operators need attention? When the data is reliable, you can take confident, targeted action to improve your network.
Because Mosaiq analyses your network from high-level KPIs down to individual trip and stop-level details, you’re able to understand not just what happened, but why. This comprehensive view supports everyone across your organisation - from strategic planners to operational teams, with insights that match their needs.
How Mosaiq makes data quality visible
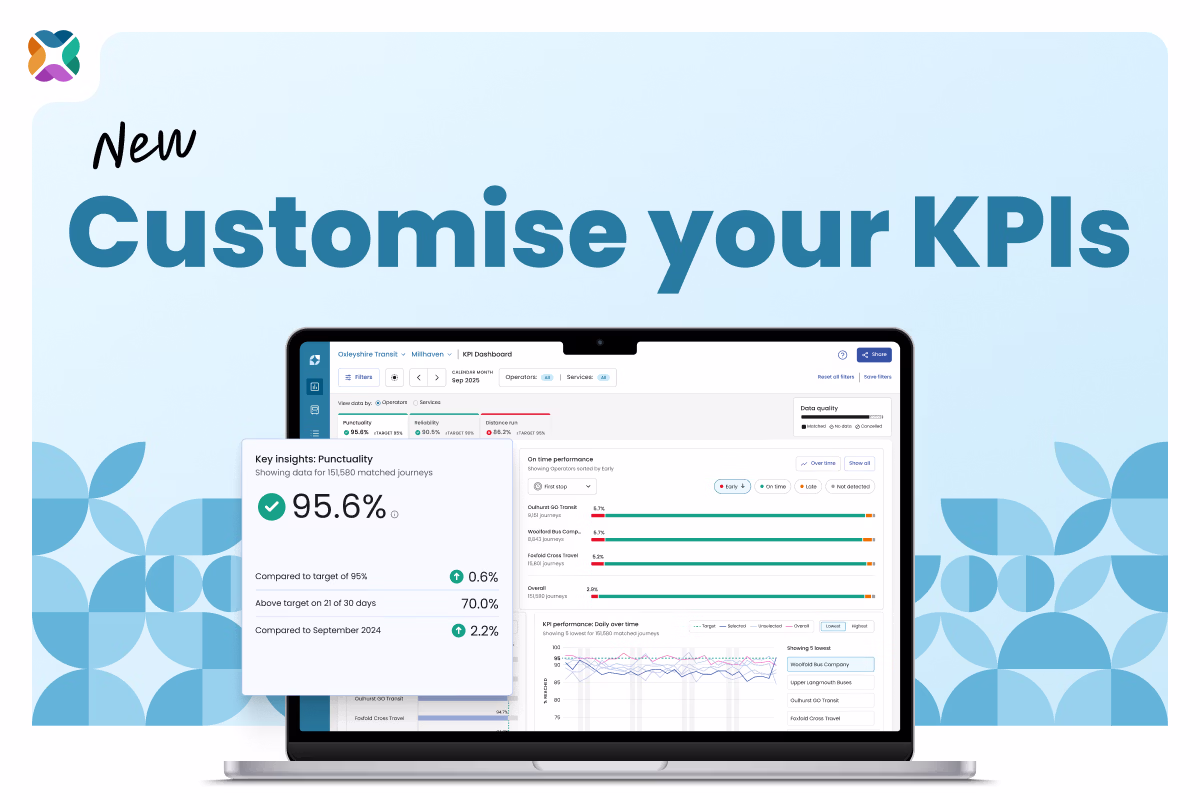
Mosaiq integrates data quality measures directly into the platform, giving you clarity alongside every metric. On the KPI Dashboard and Journeys screens, bar charts show the proportion of scheduled trips that were matched, unmatched, or cancelled. Tooltips provide counts and percentages for all data quality categories, and the charts adapt to reflect the operators you select.
The network map also visualises data quality. Stops are colour-coded based on whether vehicles were detected, giving a clear view of where gaps occur across the network. You can drill down to specific operators, services, and even individual stops, making it easy to understand exactly where improvements are needed.
This visibility ensures transparency at every level, enabling you to identify patterns, validate assumptions, and take action based on reliable insights.
Understanding stop-level granularity
Mosaiq doesn’t just look at overall trip matches. Each trip is tracked at the stop level using our stop matching process. Each stop is surrounded by a geofence, a virtual boundary that records a heartbeat whenever a vehicle enters or leaves. These heartbeats are compared to scheduled times to determine whether a vehicle is early, on-time, or late.
If the first or last stop of a trip isn’t detected, the journey is flagged as incomplete. Missing stops in the middle of a route create incomplete segments. This granularity helps you pinpoint the exact locations where data gaps occur and understand the reasons behind them, whether that’s missing vehicle location data, operational issues, or scheduling anomalies.
For first and last stops, Mosaiq may also use heartbeats just before or after a trip starts or ends to ensure the most accurate on-time performance measurement. This reduces the number of incomplete trips and provides the most reliable insights possible.
This stop-level intelligence also supports integration with other datasets, such as ticketing or patronage information, helping create a fuller picture of network activity and passenger behaviour.
Combining scheduled and Real-Time data
Mosaiq combines your schedule data, such as GTFS feeds, with real-time vehicle or stop data. This allows the platform to match actual trips to scheduled trips and identify where performance aligns with expectations and where gaps exist. By integrating multiple data sources, Mosaiq ensures a complete and accurate view of your network.
Turning data quality into action
Mosaiq goes beyond highlighting missing data. By showing unmatched trips, incomplete journeys, and operator- or service-level gaps, the platform allows you to investigate root causes and take action. You can identify the operators or services responsible for low matched-trip percentages, explore trends in no-data occurrences, and focus on specific stops or route segments where improvements are needed.
Over time, these insights help raise overall data quality, improve operational accuracy, and support better decision-making across your network.
Confidence built in
Data quality isn’t just a metric – it’s the foundation of trustworthy insights. With Mosaiq, you can see your data clearly, understand its reliability, and use it to make smarter operational decisions. High-quality data means more confident decisions, better network performance, and smoother journeys for passengers.
By combining rigorous validation, deep analytics, and a customer-driven approach, Mosaiq doesn’t just show data, it delivers clarity.
Discover how Mosaiq can help you monitor and improve data quality across your network. Book a demo or get in touch to see it in action.